Case Study · Web Development

Analytics Made Easy

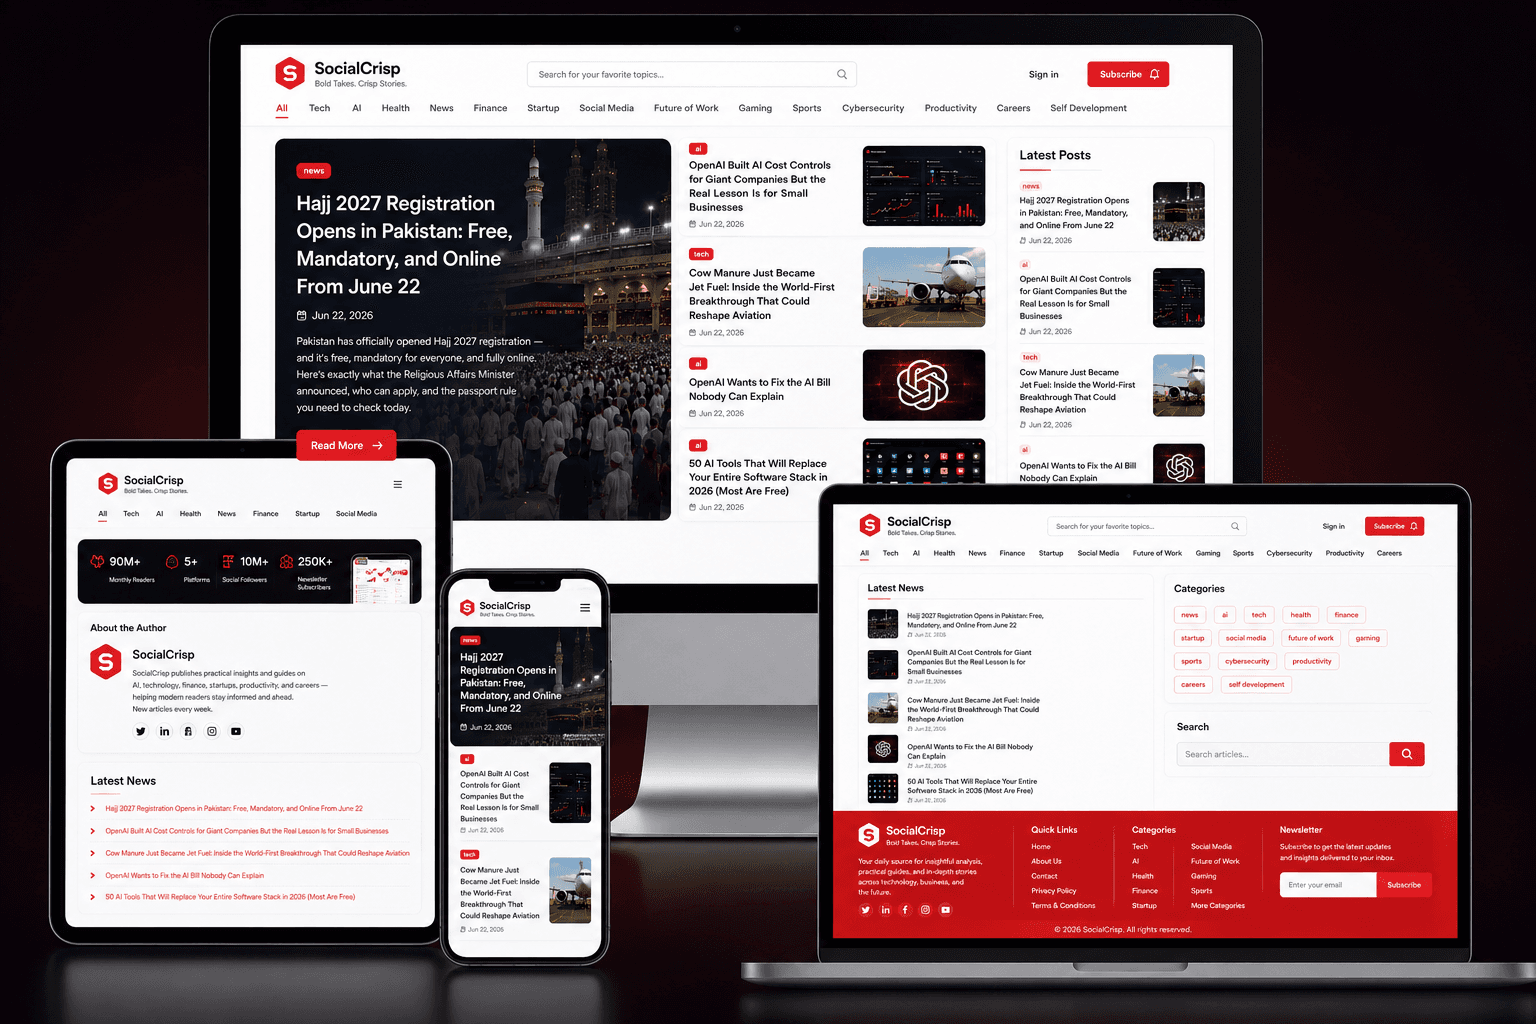
A heavy-duty real-time data visualization and tracking matrix aggregating audience growth metrics and engagement trends across massive cross-channel datasets.

SocialCrisp multi-channel data workspace dashboard

Overview

Consolidating complex web and social API performance data points into pristine visual analytical workspaces.

SocialCrisp provides digital marketing agencies and content creators with centralized performance dashboards. It processes massive, disjointed API feeds to deliver clean insights into audience trends, content reach, and growth loops.

Challenge

Processing millions of daily row changes across multi-platform networks caused query timeouts, stalling standard data visualization layers and lagging client screens during active lookups.

Approach

We optimized a dual-layer data setup: a high-efficiency Python engine collects raw platform inputs, feeding them into an indexed PostgreSQL relational database. Aggregated views are then cached via custom routes, feeding the Next.js frontend instantly.

Result

The platform smoothly tracks over a billion unique data metrics. Dashboards refresh instantly without hitting data limitations, giving enterprise teams dependable insights on demand.

SocialCrisp engagement tracking analysis charts

Inside the Admin Panel

Variant Control

Size & colour combinations tracked at the data layer.

Live Stock

Inventory levels update in real time across the catalogue.

Order Flow

Status transitions trigger automatic customer notifications.

Promotions

Promo codes created, applied, and retired without a developer.

Explore Other Case Studies