US-Based Consumer App
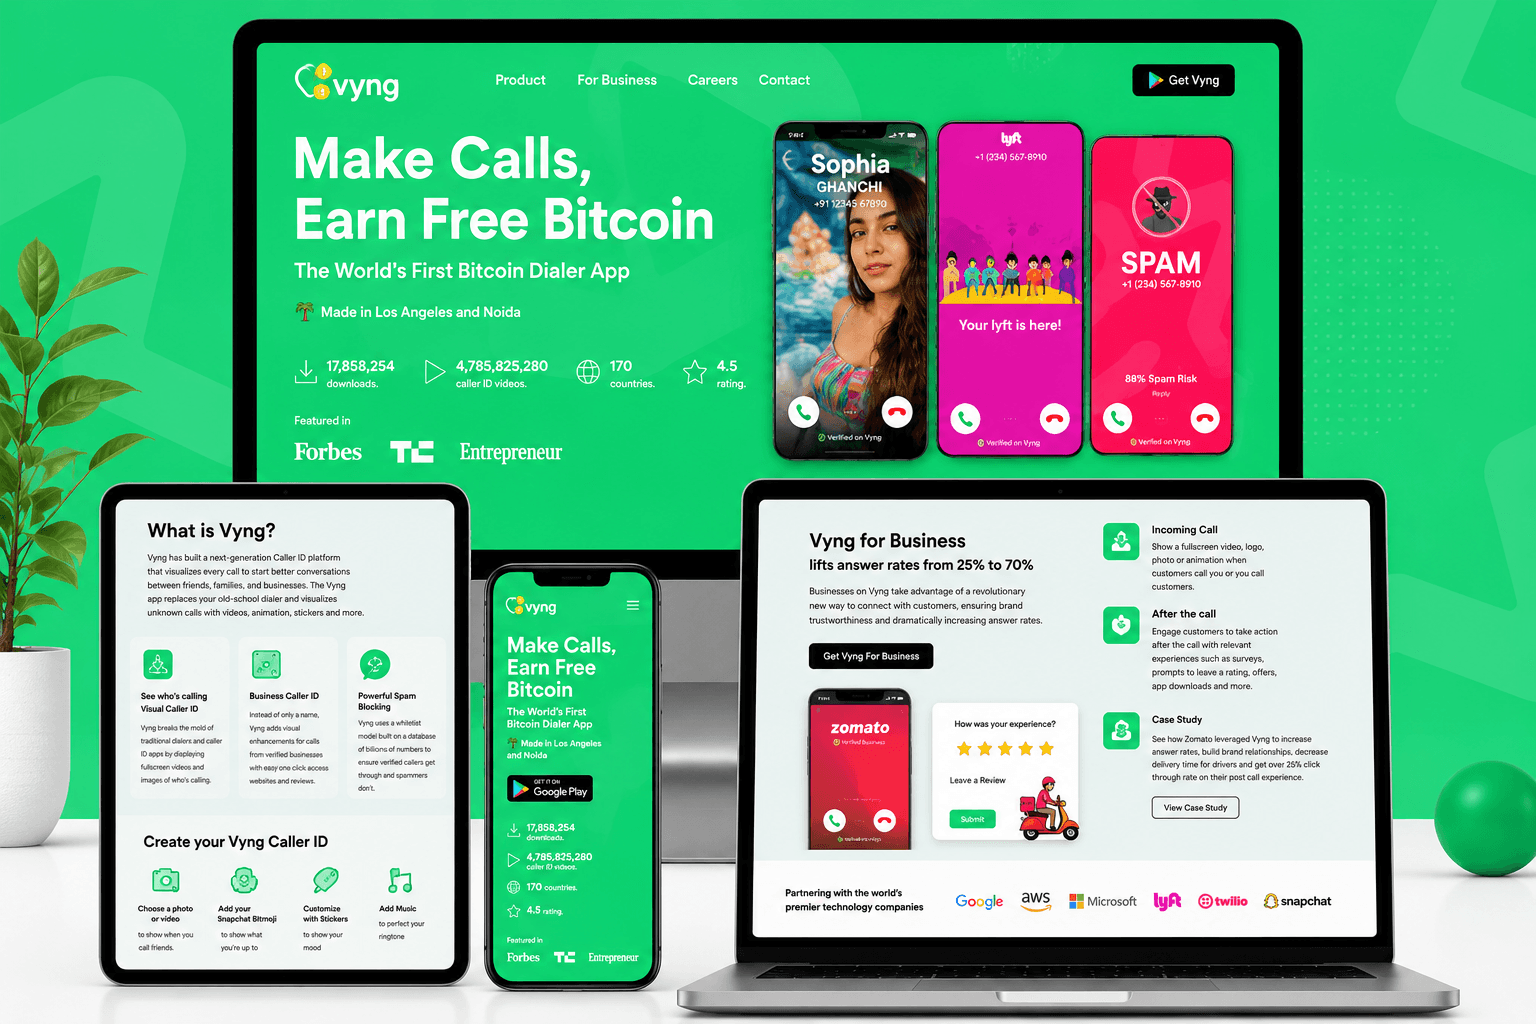
For a US-based consumer app, Technoblick built the data analysis and dashboard layer, turning raw product data into Google Data Studio visualizations a team could actually use. The work started from the decisions the team needed to make, with metric definitions agreed before any chart was built, rather than defaulting to whatever was easiest to chart.
Project Overview
We built the data analysis and dashboard layer for a US-based consumer app, turning raw product data into visualizations a team could actually use. Dashboard work fails in a predictable way, it answers the questions that are easy to chart rather than the ones the business is actually asking. This work started from the decisions the team needed to make, not from whatever data happened to be easiest to visualize.
Core Features
- Data analysis and modeling built around the team's actual decision-making needs.
- Google Data Studio dashboards built around real business questions, not default metrics.
- Metric definitions agreed with the team before any chart was built.
Technical Highlights
- Built on Google Data Studio for accessible, shareable dashboards.
- Data modeling done upfront to ensure dashboard metrics matched agreed definitions.
- Dashboard structure built around decisions the team needed to make, not around available data fields.
Project Impact
This client's team went from raw product data to dashboards built around the actual questions they needed answered, not the questions that happened to be easy to chart. Agreeing on metric definitions before building anything meant the dashboards were trusted and used, rather than becoming one more report nobody opens.
Technologies Used
Project Details
- Data Analysis & Modeling
- Google Data Studio Dashboard Design
- Metric Definition & Reporting Strategy